Once we receive the OSC in Grasshopper we will need to parse that data stream. The column on the left shows how the original format of the data and on the right is how we would like to parse the data into groups of X,Y, and Z coordinates. Keep in mind that the unit of measure for Vicon Tracker is millimeters.
Step 1:
/vicon/frame
989
100
/vicon/marker/Object/Object1
100.878
300.474
150.892
/vicon/marker/Object/Object2
-200.726
600.567
200.387
/vicon/marker/Object/Object3
350.489
-400.575
-300.575
Step 2:
/vicon/frame
989
100
/vicon/marker/Object/Object1
100.878
300.474
150.892
/vicon/marker/Object/Object2
-200.726
600.567
200.387
/vicon/marker/Object/Object3
350.489
-400.575
-300.575
Step 3:
/vicon/marker/Object/Object1
100.878
300.474
150.892
/vicon/marker/Object/Object2
-200.726
600.567
200.387
/vicon/marker/Object/Object3
350.489
-400.575
-300.575
Step 4:
100.878
300.474
150.892
-200.726
600.567
200.387
350.489
-400.575
-300.575
Step 1: The original data stream.
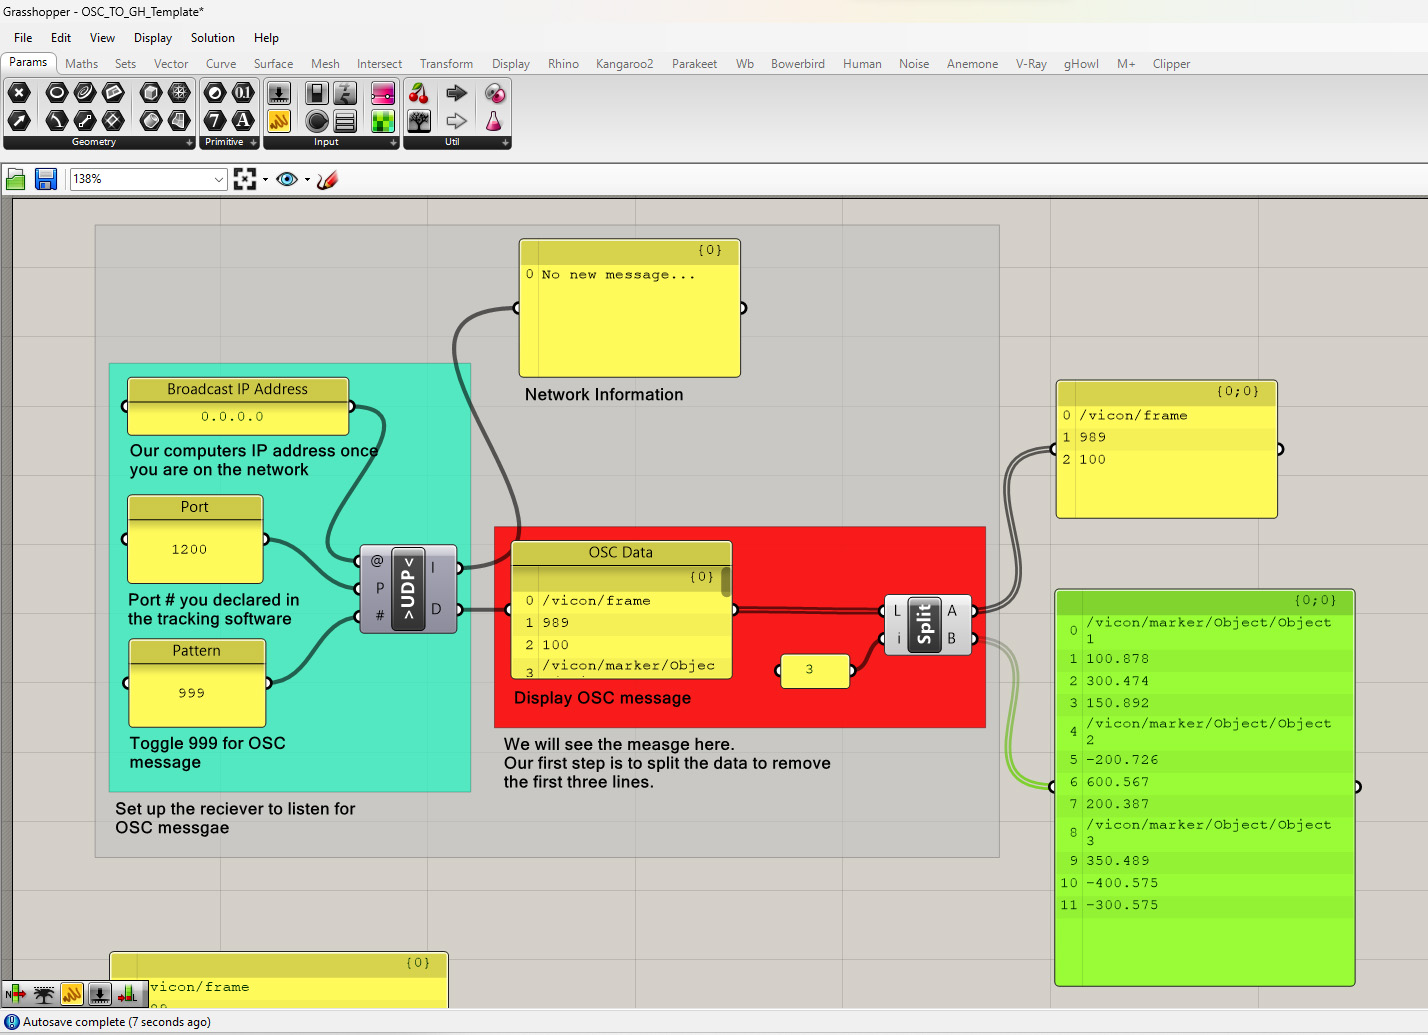
Step 2: The first thing we need to do is remove the first 3 lines which list the frame number and the frame rate. We will do this by splitting the list. We will do this by using the Split List component. This node can be found in the “Sets” tab and in the “List” module. The Split List Component has two inputs: 1. The list and 2. the index that you would like to use to split the list. Index is the value or address of an item in a list. The indices start with 0 and continue in increments of 1. We want to split the list at index 3. The output of the component will be the two portions of the original list. You can see in the Panels the two lists.
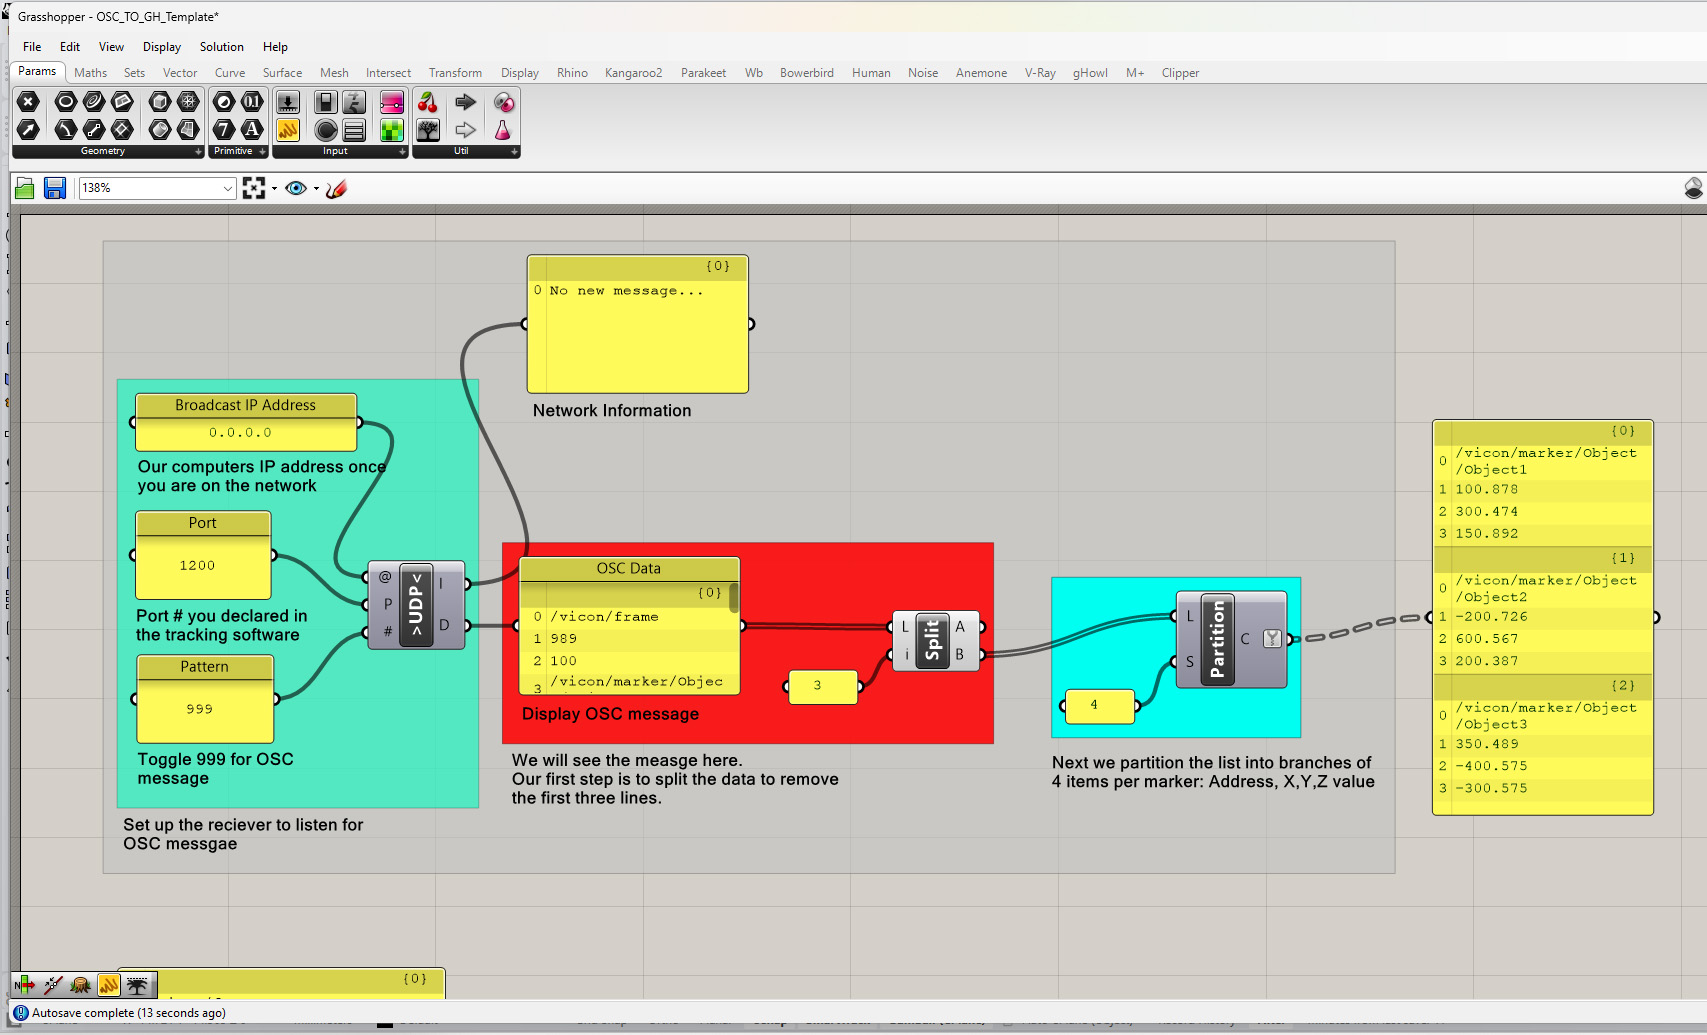
Step 3: Next we need to partition the list into groups of data per marker. To do this we will use the Partition component. This node can be found in the “Sets” tab and in the “List” module. You can see that each marker has 4 data items. The first is the address of the marker: Vicon/marker/”object name“/”marker name” and the following 3 numbers are the X,Y, and Z coordinates of that marker. We want to divide this data into groups or “branches” per marker. The partition node will do this for us. The inputs for the partition node are the list and the size of the groups you would like to divide the list into. In this case it is 4. You can see the output in the panel to the left divided into groups or branches of 4 items.
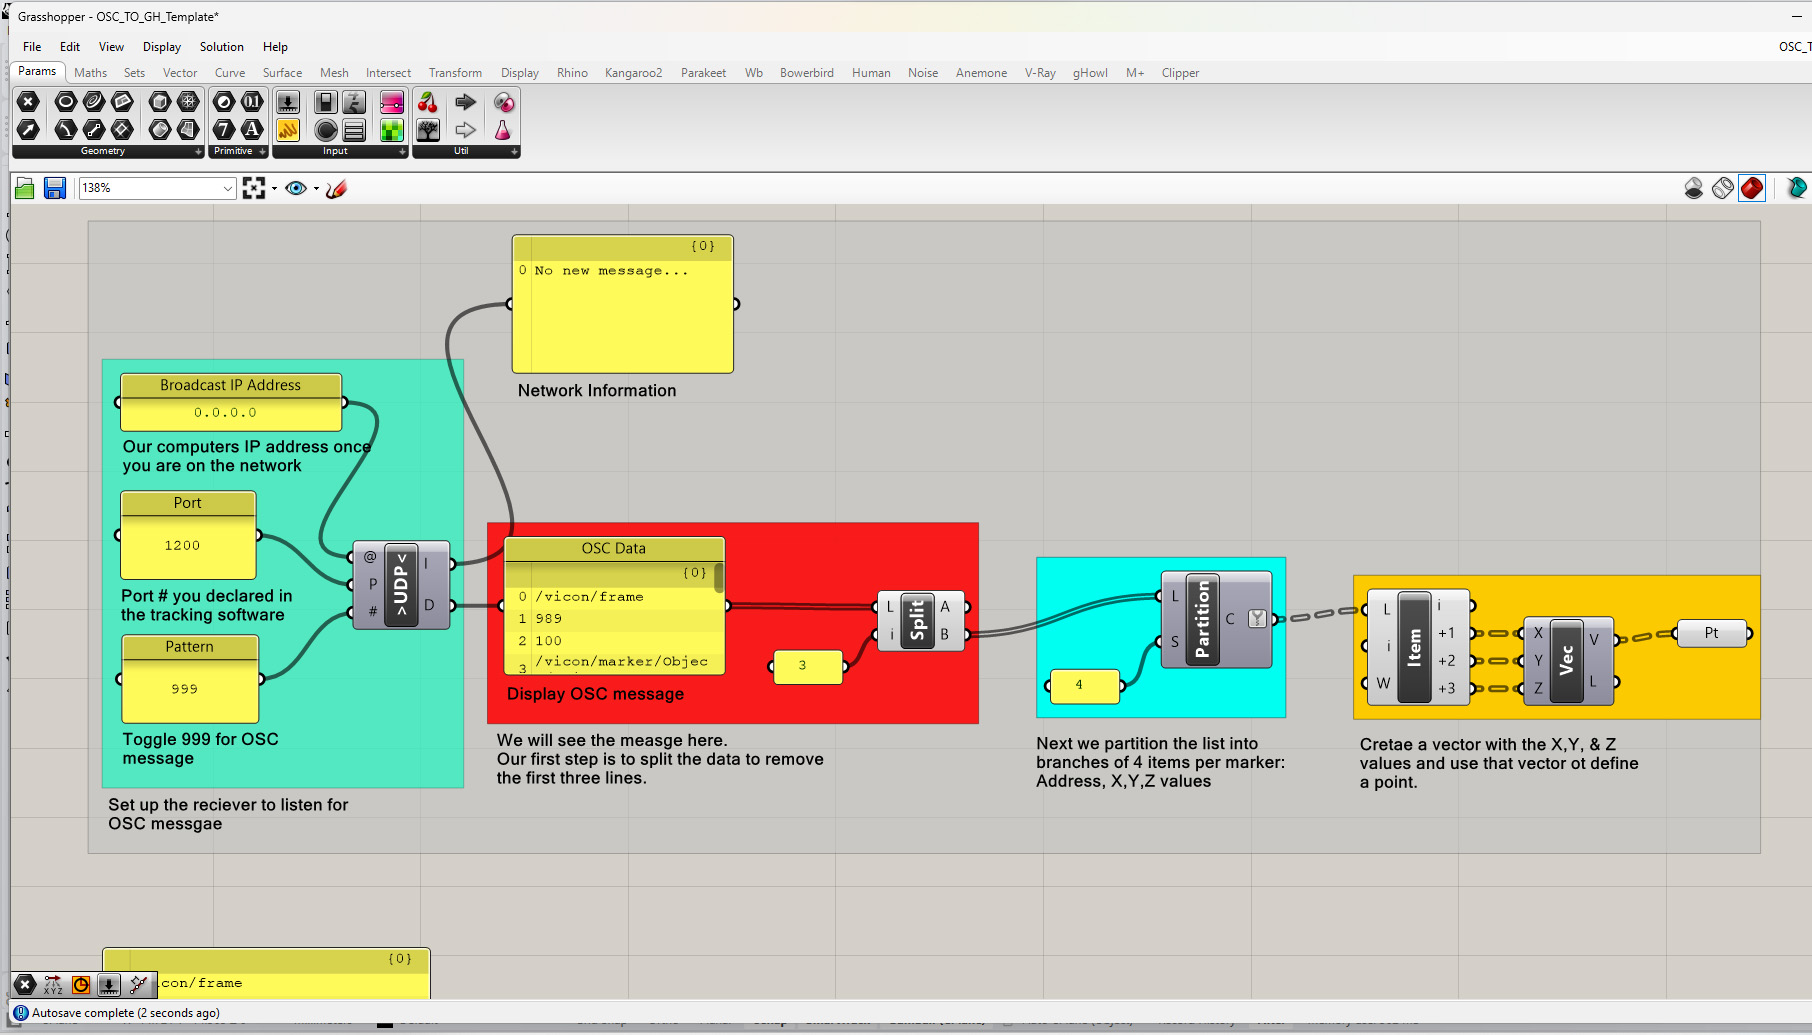
Step 4: Once the list is partitioned into groups of 4 values we need to list the individual values to turn the X,Y, and Z values into vectors.
a. To do that we use the List Item component which can be found in the same “Sets” tab and in the “List” module. The List Item Component takes the list as an input and the index (or start index) you would like to get the value for. This component has a dynamic output array. You can zoom in until you see a plus symbol at the bottom of the component and click the plus until you have an output for each additional index. We need 4 so we will click the plus symbol until we have 4 outputs.
b. We will then create a vector with the Vector XYZ component. The Vector XYZ component is in the Vector tab and the Vector module. The Vector XYZ component has 3 inputs: X, Y, and Z Values. Plug the last 3 values from the out put of the List Item component into the Vector XYZ component inputs. We do not need the first value from the List Item component because it is the text-based address of the marker.
c. To visualize each vector we need to create a point. To do that we plug the Vector XYZ output into the input of a Point component. The Point component can be found in the Params tab and the geometry module.
You can download the final definition here: OSC_TO_GH_Vectors